Traditional agile forecasting involves breaking down an entire backlog into stories, getting point estimates on each story, summing these, and then dividing the sum by the team’s velocity to yield a projected completion date. This process is time-consuming, taxing on developers, creates waste and the results are questionable at best. It also doesn’t work well across teams (i.e. doesn’t scale). Because of these flaws, I wanted to test the underlying assumption that relative estimation yields better results than absolute and see if there might be a better way to forecast using the wisdom of crowds.
Terms
Absolute Estimation: A straight-out guess
Relative Estimation: Comparison-based guess
Wisdom of crowds: A theory that averaging the guesses from a large population yields a highly accurate estimate
Understanding Relative Estimation Theory
There is a great article on the Agile Alliance website that outlines Relative Estimation and the theory behind it.
Hypothesis:
If the underlying assumption of relative estimation is true, then a given population should be able to estimate the number of jelly beans in a container with higher accuracy than straight out guessing (absolute estimation).
Conversely – should the absolute estimate be closer in accuracy than the relative estimate, then absolute estimation with the wisdom of crowds could be considered a better tool for forecasting than relative estimation.
Materials Used in this Experiment:
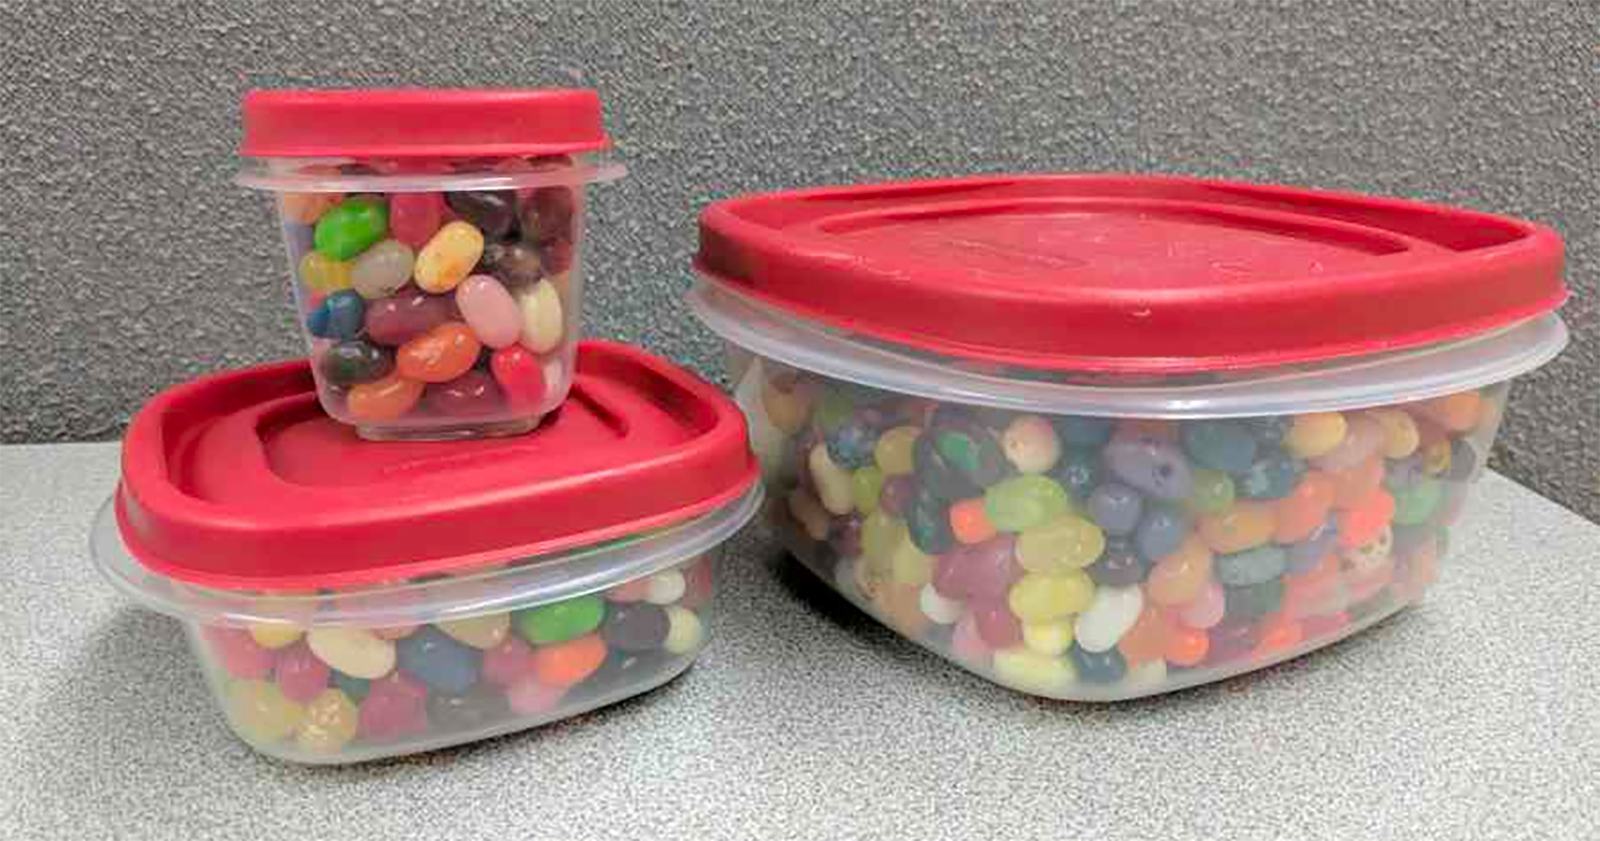
Three transparent Tupperware containers:
– a small one
– a medium one
– a large one
Jellybeans (enough to fill the three Tupperware containers)
A notepad or spreadsheet to hold a data table of 150+ rows and two columns in which we will record our results. Columns are titled Guess One – Absolute, and Guess Two – Relative.
A population of around 150 people. (Dunbar’s number was chosen for this experiment as it seemed a good starting point for a “crowd”.)
One person to collect data.
Procedure:
A population of 150 people was asked to guess how many jelly beans are in a container. (An absolute guess.) After making this guess, they are then shown two different-sized containers and told the number of jelly beans in these containers. Armed with this new information, the same person then takes a second guess against the original container i.e. a relative estimate. The data from the two guesses is collected, recorded, and finally collated for the average across the population.
Step-by-step process
- fill the smallest container completely with jelly beans
- count the jelly beans in the small container (you may need to empty and refill to do this)
- record the count of the small container (perhaps write it on the bottom of the container so you don’t lose it)
- do steps 1 through 3 again with the medium container
- fill the large container with jelly beans. Do NOT count the beans in this container. It’s important that you (the surveyor) do not know until all the data has been collected, what the jelly bean count is for the large container so you cannot anchor in any way. Data collection should be done double-blind.
- Collect guesses: You may survey individuals one on one or in groups. If in a group, it is important to communicate to the group that when they are making a guess, they keep it to themselves so as to not anchor anyone else around them. The spiel to participants should go something like this:- “Your involvement as a survey participant in this experiment is short and should take no longer than 5 minutes, and it usually averages around 2-3 minutes. I am going to ask you to silently write two estimates on a piece of paper. The first will be numbered 1 and the second numbered 2. Show an example of what you expect the piece of paper to look like at the end with scribbles where the number estimate is to go. For example “#1 <your guess>” and below it “#2 <your guess>”. Your guess being an integer that represents how many jelly beans are in a container that I am going to show you shortly. At that point, I will ask you for your first guess. Silently put your guess on your paper and be careful not to announce or share it in any way for fear of influencing others. Also, be vigilant not to look at others if at all possible so as to avoid any anchoring. After the first guess, I will give you some more information and then ask for a second guess which you will write in the number two position. Once I collect the piece of paper from you with your guess, then your participation is complete. Again – please do not share any of your guesses or say them out loud during the process. Any containers I show you, you may not ask about what the volume is.”
Results (Data):
JellyBeans1 contains the guesses that were collected for this experiment. Column one is the first absolute estimate, and column two is the second relative estimate.
Population size: 154 people
The actual number of jelly beans in the container: 1009 (counted at the end of the experiment)
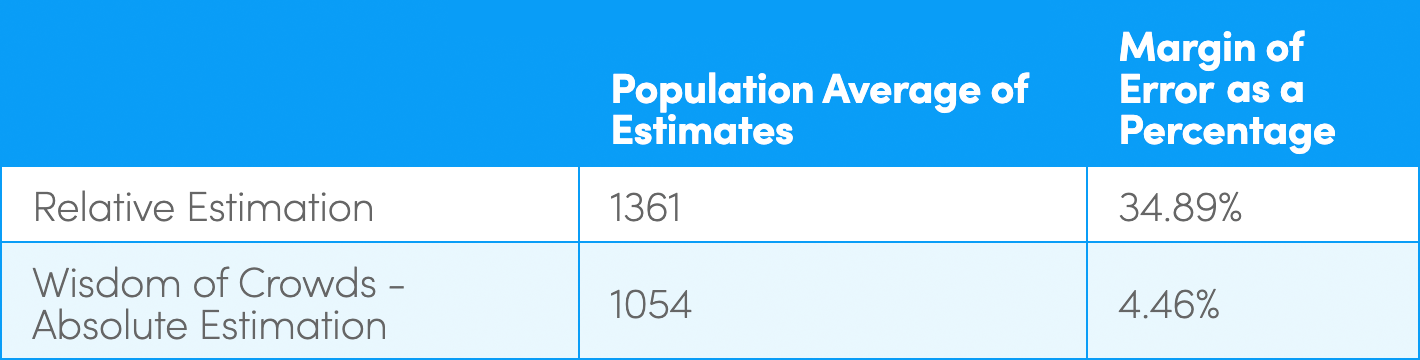
Theory: Absolute estimation with the wisdom of crowds is more accurate than relative estimation
Absolute estimation was roughly seven times more accurate than relative estimation (with a population size of 150) i.e. roughly 5% variance using absolute estimation compared to 35% (rounded) with relative estimation. This suggests that averaging an absolute guess from a large population is a better tool for estimation compared to relative estimation.
In this initial experiment, we chose a population size of around 150 based on Dunbar’s number as the maximum size of a tribe. A tribe-sized group sounded like a good place to start for a crowd.
How big is a crowd?
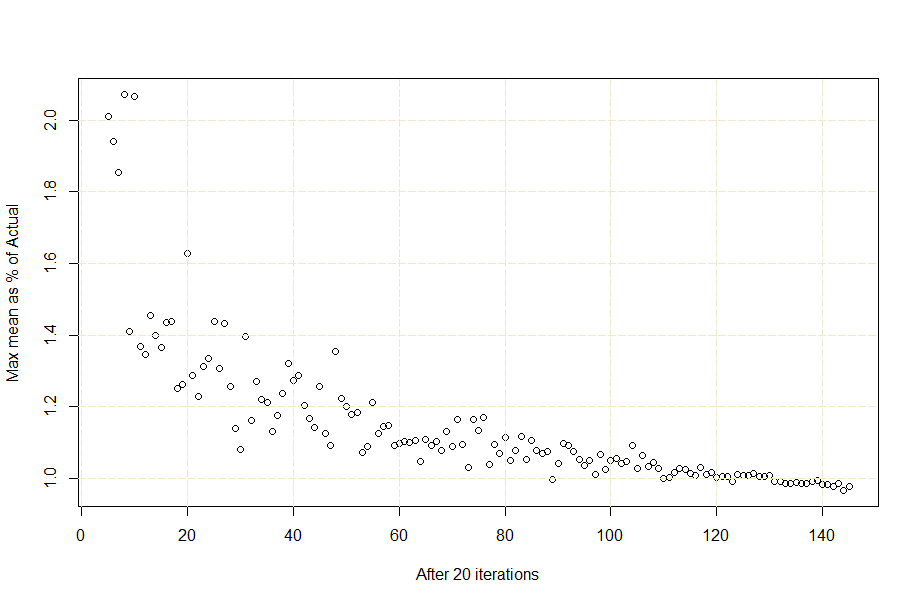
Well, it depends. It depends on how accurate an estimate you want/need. Using the data of 154 participants, we pulled off multiple subpopulations of different sizes and plotted the %deviation against the population size. The graph will help you determine what size population you need, to what level of accuracy you desire. Note the diminishing returns as it the curve plateaus approaching 150.A rough translation of this graph shows that if I was happy with 80% accuracy, I could get that with a population of around 20-30 people. To get that to 90%, I will need around 60 people. 95% kicks in around 120 people.
Try it Yourself
If you have repeated this experiment for yourself or have done any further research into this field, I would be very interested to hear about it. Please email Ron Quartel using the email address: info at fast-agile dot com. Watch this space for further experimentation that we are currently conducting in the area of estimation and forecasting.
Further Reading and References
Relative Estimation definition and history
The Wisdom of Crowds by James Surowiecki (Affiliate)
Another Example of the Wisdom of Crowds for estimation (Note that result was also within 5%)
Sir Francis Galton (The founder of the wisdom of crowds theory)


![[Case Study] Lessons from descaling 25 Scrum teams](https://www.agilealliance.org/wp-content/uploads/2024/12/descaling-teams-1200x630-1-150x150.jpg)


![[Case Study] Lessons from descaling 25 Scrum teams](https://www.agilealliance.org/wp-content/uploads/2024/12/descaling-teams-1200x630-1-300x158.jpg)