

Choosing the right agile metric to measure agile success is really simple, right? I wish that were the case, but in reality, selecting the correct agile metric can be a little tricky.
So, how do you get the most out of your agile metrics? I reviewed the 9th annual State of Agile survey, which compiles insights from nearly 4,000 respondents, to find out how agile practitioners are measuring the success of their agile initiatives.
#1 On-Time Delivery
According to the State of Agile survey, 58% of the respondents* said they measured the success of their agile initiatives by on-time delivery.
With agile, our schedule is fixed and our scope is flexed. What does that mean for on-time? Well, time just happens, so theoretically, we are always on time. But, on-time is generally measured in context with the expectations about what will be delivered. To measure and have visibility of what is being delivered, we may look to the out-of-the-box metrics of the burndown or the burnup.
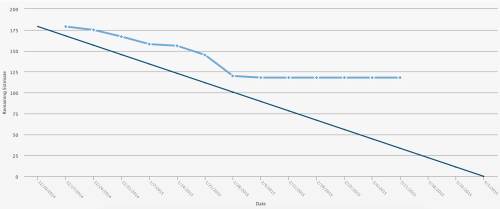
For instance, in this VersionOne burndown chart, you can see progress as the team heads toward an expected end date.
This burnup chart, on the other hand, allows you to see the trend of getting stuff done, as well as the impact of scope changes.

#2 Product Quality
A total of 48% of the respondents to the survey said they measured the success of their agile initiatives through product quality.
Quality is often measured in multiple ways, including looking at customer satisfaction, revenue growth, and the technical aspects of testing conducted throughout the development life cycle. With agile software development teams, we’ll look at our velocity of completing working software with quality built in. We tightly couple continuous testing and inspection throughout the lifecycle of the development, so we’ll constantly be monitoring testing trends as well as constantly inspecting build and code health.
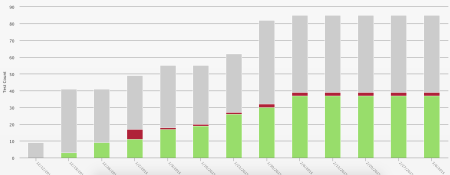
For instance, in this testing trend chart you can see the cumulative progress around testing activities. Ultimately you want to see all green, but a large amount of red along the line might reflect some issues in the code base or process.
#3 Customer/User Satisfaction
The survey found that 44% of respondents measured the success of their agile initiatives by customer or user satisfaction.
As with all these benefits, there are multiple ways to measure the outcomes. In the case of customer/user satisfaction, these include looking at the Net Promoter score, sales figures, number of support calls vs. number of features delivered in a time period, or usage statistics of product or site capabilities.
#4 Business Value
Approximately 44% of the respondents to the State of Agile survey stated that they measured the success of their agile initiatives by business value.
And several of the principles of the Agile Manifesto recognize the importance of delivering business value. Measuring business value is very explicit when we know that there’s a contract for work to complete or a compliance need and fines if we don’t finish the work. On the other hand, sometimes measuring value is prospective or speculative in the sense that the market inputs drive decisions and the value is often a best guess. Having a business value score applied to the features to be delivered can measure value.
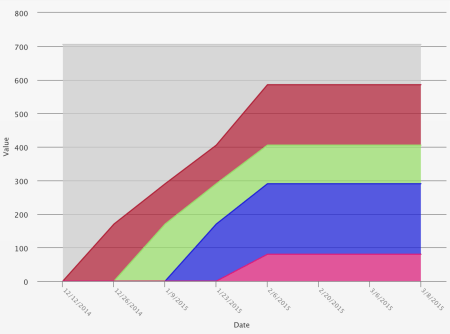
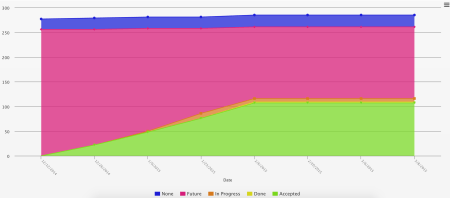
Here’s a sample epic cumulative flow chart based on value. This helps you see the delivery of anticipated business value as features and other large stories are completed.
#5 Product Scope (Features, Requirements)
Another 39% of the respondents answered that they measured the success of their agile initiatives with product scope.
Setting a goal around what to get done over the next three months, then tracking status, and getting it completed is hugely rewarding. Actually having real-time feedback as to the progress of work is valuable to everyone on the team, from the engineers to the program managers. With agile software development projects, you can always rely on the burndown charts, or just visualize the progress of the cards moving from left to right on the project kanban board.
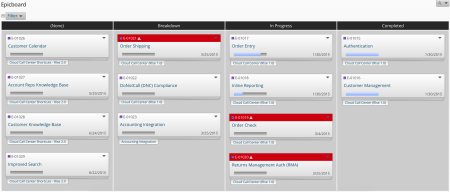
Here’s an epic board in VersionOne that helps the team track and visualize the progress of features at a program level. Or if you’re using Scaled Agile Framework® (SAFe®), you can see progress at the release train level.
#6 Project Visibility
Project visibility was the measure of choice for 30% of respondents to the survey.
One of the best ways to build trust is transparency. That means having the plans out in the open and making progress visible to all. Sharing progress at multiple dimensions provides the different stakeholders with information that makes sense from their point of view. Metrics that show featured or overall progress against a targeted plan can provide great insights.
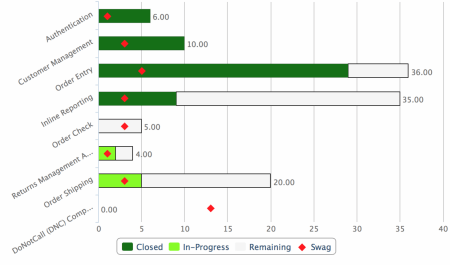
In this chart, you can visualize progress on a feature and known work. The red diamond represents what was actually anticipated, so it’s easy to gauge whether you are above or under the anticipated scope.
The other reason visibility is important is that we need to have alignment among internal teams so they can best manage their work in relation to component or service dependencies.
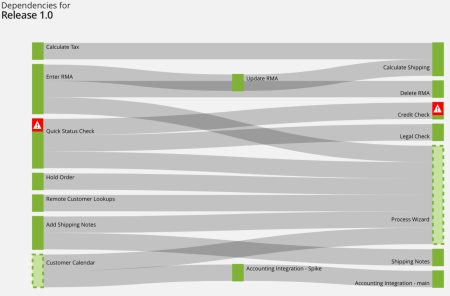
Understanding the impact of one team’s work on another team is critical. By looking at the dependency chart below, it’s easy to identify the stories at risk.
#7 Productivity
According to the State of Agile survey, 29% of the respondents said they measured the success of their agile initiatives through productivity.
The concept of productivity in an agile world is a measure of outcomes, not output. So looking at burnup for a product or based on value is hugely impactful. Simply looking at a burnup of count of stories or features over time is a great way to understand how much the team is actually delivering.
#8 Predictability
Approximately 25% of the respondents from the survey said they measured the success of their agile initiatives by predictability.
A predominant metric used to assess predictability is the velocity trend. For a three- to four-month period, this shows how much work has been completed at a sustainable pace on average. A wildly fluctuating velocity might reflect a team that is changing, work that is unpredictable, or simply a team that is still getting used to defining work small enough to complete in an iteration.
A velocity trend chart like the one below not only helps you see the performance but also gives you visibility into whether or not the team’s output is at a predictable state – as this one shows.
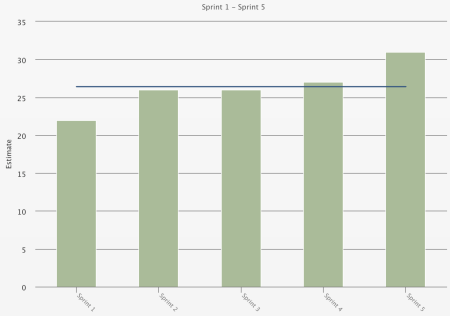
You can always try to assess velocity based simply on the count of story cards completed every week. This is usually the best indicator of predictability.
#9 Process Improvement
Another 23% of the respondents said they measured the success of their agile initiatives by process improvement.
A core tenet of all lean and agile mindsets is continuous improvement – constantly getting better. But how do you know you are getting better unless you are measuring the outcomes? There are all the metrics above that help, but there’s also the extremely helpful cumulative flow chart which shows how well work is flowing through the lifecycle.
With this team-level cumulative flow chart, you can see where bottlenecks or slowdowns may exist.
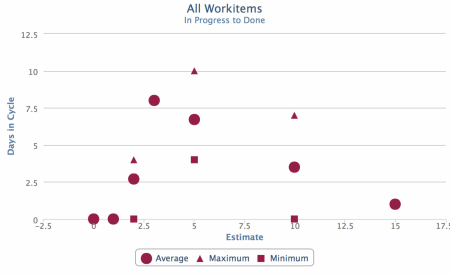
Also, there’s cycle time – which helps us with planning and predictability. Cycle time is a great metric to view over time to see if process tweaks and adjustments are having an impact on productivity.
For instance, in this cycle time report, you can see the level of variability and performance across the various estimated pieces of work.
#10 Don’t Know
Just 11% of the State of Agile survey respondents said they didn’t know! Well, if you don’t know the benefits, try to start looking at the metrics above. You’ll see improvements in delivered value, better quality around what is produced, a more predictable cadence, and ultimately happier customers.
Conclusion
These results show that there isn’t just a single metric that everyone uses. Different organizations, types of management, and teams need different metrics.
Not sure which metric is right for you? Check out the 9th annual State of Agile survey to learn more about what nearly 4,000 of your peers are doing.
What metric do you use to measure your agile initiatives’ success?
*Respondents were able to make multiple selections.
State of Agile is a trademark of VersionOne, Inc.