
1. INTRODUCTION
Determining where to focus Agile coaching and training in a large Tech organization can feel a bit like playing Whack-a-Mole. With hundreds of Agile practices and mindsets to potentially target and hundreds of teams at various levels of maturity and scale, how do you know which ones to target that will really make a difference? How do you decide what to target at the enterprise versus the divisional versus the team level? It’s natural to just focus on the areas that are least mature, rather than on the ones that might have the most impact.
In 2017, Capital One surveyed over 1,200 technology teams (including Product Owners) about Intent, Planning, Frequent Delivery of Value (Flow), Team Health, Scaled Agile Practices, Continuous Improvement, Leadership, Inner-sourcing and Engineering Practices. Capital One’s typical approach to using Agile maturity survey results had been to target the lowest scoring items for improvement. We used a statistical approach to analyze the data and then target the most important items, not just the lowest scoring ones.
We hypothesized that many of the survey questions could be assumed to cause the outcomes we really care about – Frequent Delivery of Value and Team Health. For instance, a team that scored themselves highly on the question “Has trust within the team, enabling open and honest interactions” would also score themselves highly on the outcome “I would recommend a colleague or friend to work on my team” because the high psychological safety of their team is one of the reasons team members would make that recommendation. Another example: we hypothesized that teams that scored themselves highly on the question “The amount of work in progress (WIP) is limited to minimize task switching” would also score themselves highly on the question “How consistently does your team focus on frequent delivery of business value through incremental releases?” because the practice of limiting WIP is a method for increasing focus for frequent delivery. We reasoned that measuring the strength and significance of correlations within the survey would reveal what practices really make a difference to Agile outcomes at Capital One. Communicating these findings would influence change agents towards improving practices with the largest impact rather than just improving the least mature ones and give Capital One a higher ROI for its Agile coaching efforts.
2. Background
Doug joined Marie on a small centralized Agile Coaching team when he started at Capital One in May 2017. As part of his onboarding, he asked an executive moving out of Agile Enablement to another role to identify which products and services of the Agile Enablement organization were worth preserving and growing. Among the offerings that had been developed and tried over the previous two years, the transitioning executive pointed Doug to the Tech Agility Survey as one of the “keepers.” This custom Agile maturity survey was originally designed to meet the needs of Agile Coaches and SAFe® Release Train Engineers (RTEs), who lead Agile Programs with multiple teams. This easy-to-execute, standardized Agile maturity assessment tool covered a range of topics:
- Intent
- Planning
- Frequent Delivery of Value
- Team Health
- Scaled Agile
- Continuous Improvement
- Leadership
- Engineering
The survey included one or two high-level questions for each topic area, six to ten specific questions about each topic area, and a comments box for the survey recipient to provide additional context on the answers they supplied. On average, respondents would take about 20 minutes to complete the survey. The Agile Champions in the different Capital One organizations would request ad-hoc executions of the survey for their specific set of teams, and then combine the survey data, observations, and supplemental interviews to identify themes and opportunities and execute improvement plans.
Soon after Doug joined Capital One, the executive sponsor of the Tech Agility Survey decided to expand and standardize it as a semi-annual survey of all individuals working on teams at Capital One with responsibilities for building and/or maintaining software and/or infrastructure – over 1,200 teams. The stated objectives for making the survey Tech-wide were: standardization, benchmarking, and re-use across the enterprise. With a background in statistical analysis, Doug immediately saw the opportunity to use the survey results from such a large population sample to identify relationships between the dozens of practices and perceptions measured by the survey and infer the relative size of their impacts on the Agile outcomes that people care about.
Marie, also an internal Agile Coach and a long-time employee at Capital One, understood the culture including which language and communication styles resonates with Capital One leadership and teams. When Doug began to show her statistical analysis of the survey results, she recognized the power of these insights and quickly identified the audiences who could be influenced to drive change. Doug and Marie naturally and organically became partners in analyzing the results and communicating those results to the organization.
3. Launch of the Survey AND RESPONSE
The decision to promote the survey from an ad-hoc, on-demand tool to a semi-annual survey of all members of our 1,200+ Scrum & Kanban teams was only successful because Agile Champions from across our company rallied with us to promote the survey. For context: Doug and Marie work in an Agile Enablement organization that owns “shared” capabilities, tools and services like Agile Training, Agile Lifecycle Management Tools and Agile SDLC Controls for all of Tech. Leveraging these capabilities, each divisional CIO pursues their own unique strategy for Agile Transformation tailored to their organization and executed with their own Agile Coaching and Agile Delivery leadership. Doug and Marie’s Agile Enablement organization was generally successful leveraging these Agile Champions across the Tech organization to encourage participation and drive up response rates. The survey enjoyed a strong executive mandate, which overcame the reluctant fears of survey fatigue – (“Not another survey!”) – and survey irrelevance (“Why should we do this, when we are already doing our own divisional surveys?”)
The survey closed with a 21% response rate. We were excited to have more than 2,600 associates respond, including over 1,400 software engineers!
When we executed the survey, we found that some of our divisional colleagues’ concerns about the survey were justified. When we scaled to the enterprise, we had taken a questionnaire designed for sets of 5 to 25 teams to a much larger population without redesigning the survey for the larger scale. This lead to negative feedback from the survey takers: the survey was too long – over 100 questions – and individual questions were not relevant to certain teams and organizations. Asking technology operations teams using Kanban to answer questions specific to Scrum and SAFe were confusing. However, once the survey was done and despite these limitations, many of the divisional Agile Champions used the results to test hypothesizes about their divisions, to engage with executive leadership about their Agile transformation journeys, then formulate and communicate divisional plans for Agile improvement. The survey did get a design make-over for 2018 … but that’s a topic for a future experience report. 😊
4. Analysis of Results
We quickly published descriptive summaries of the survey results and provided Agile Champions in the different divisions with individual results for their areas to analyze for their specific improvement opportunities. While the different divisions conducted their own analyses, our Agile Coaching team did analysis of the results to answer key questions from our executive leaders about departments, locations, methodologies, roles, and team size. These are just a few of the questions and results:
Do smaller teams score better than larger teams? One of the first findings we uncovered was the relationship between team size and their scores across the topic areas. Some of our divisional CIOs and executive leaders were expecting that teams less than 5 were more ideal. The survey results revealed that the “sweet spot” was between 6 and 11 people, somewhat higher than the Scrum guidance of 3 to 9.
Do teams with professional Scrum Masters have better results than teams without Scrum Masters? We found that Scrum Masters generally rate their teams lower than software engineers do. To get an apples-to-apples comparison, we had to drop the Scrum Master responses and reframe this question as “do software engineers on teams with Scrum Masters report higher Agile maturity than software engineers on teams without Scrum Masters?” We found scores for teams with professional Scrum Masters were 15% higher than scores for teams without them.
How is team morale? Are our team behaviors healthy? Team Health on average was rated high compared to other topics in the survey, including high marks in “Has trust within the team, enabling open and honest interactions”, “Values differences and works through conflict,” and “Is empowered to determine how to deliver.” We experimented with a new overarching question for Team Health using a Net Promoter Score (NPS) question: “Would you recommend a friend or colleague to work on your team?” Using a simple mean average calculation, the scores were high. In order to keep focus on our teams and give visibility to some survey comments that might have otherwise been overlooked, we decided to use the NPS calculation, a measure more sensitive to detractors. [An NPS is calculated as “Promoters” minus “Detractors” ranging from -100 to +100. When we asked team members “would you recommend a friend or colleague to work on your team?” on a scale of 1 “definitely” to 5 “definitely not,” we then converted scores of 1 to “promoter”, 2 to neither and 3, 4 or 5 to “detractor.” For example, a team of 10 people with three people responding “1,” five people responding “2,” and two people responding “4” would have an NPS of 30% (promoters) minus 20% (detractors) = 10 NPS. Although NPS typically uses a 0-10 scale, we decided to keep the scale consistent for all of our survey questions.]
Due to the large sample size, Doug was eager to mine the data for even deeper insights into the relationships between aspects of Agile maturity measured by the survey. Marie started engaging with him about why these findings would matter. She helped focus on the importance of the ultimate goals most organizations at Capital One had for introducing Agile – enabling frequent delivery of value while fostering an environment of healthy, happy teams. With this north star in mind, Doug used linear regression analysis on the data to answer the more specific questions “What behaviors/practices are the key contributors for teams who rated themselves high in Frequent Delivery of Value and Team Health?”
The diagram below (see Figure 1) illustrates the results of our analysis for Frequent Delivery of Value.
Planning and Scaled Agile practices were the topic areas with the strongest correlations to Frequently Delivery of Value. Intent (the definition and communication of business intent along with product management) and Team Health characteristics were most highly correlated with Planning while Leadership and Continuous Improvement practices were most highly correlated with Scaled Agile practices. Innersourcing and Engineering practices had little-to-no correlation with the other topics in the survey. The width of the arrows represents the relative size of the relationship between the topics.
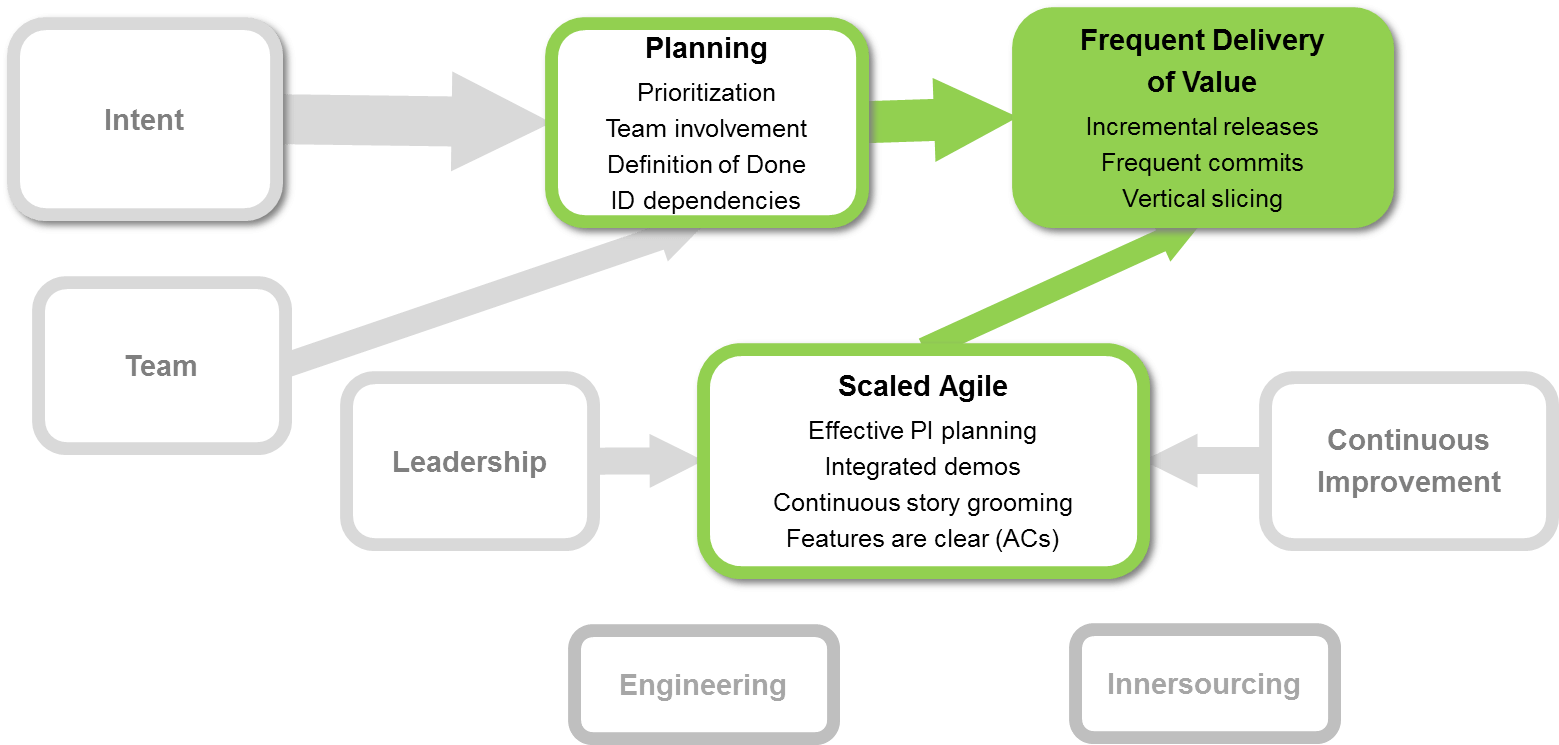
Figure 1. Correlations between factors influencing Frequent Delivery of Value
Within the topics of Planning, Scaled Agile and Frequent Delivery of Value, we then regressed the ~10 more detailed questions on “How consistently does your team focus on frequent delivery of business value through incremental releases?” and reported the most impactful practices for each topic.
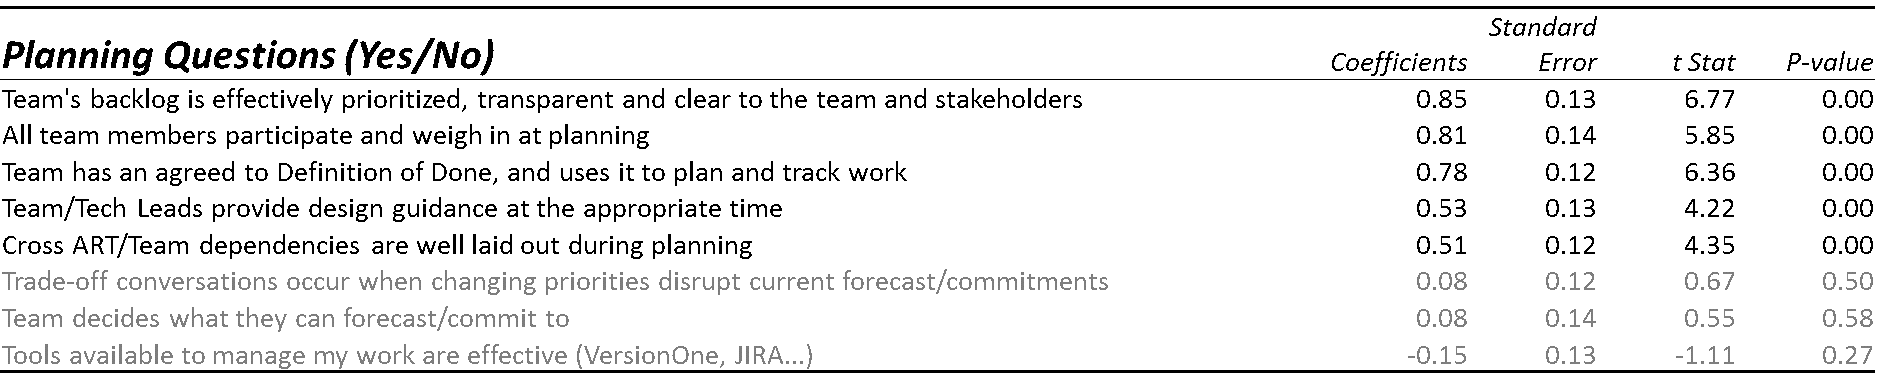
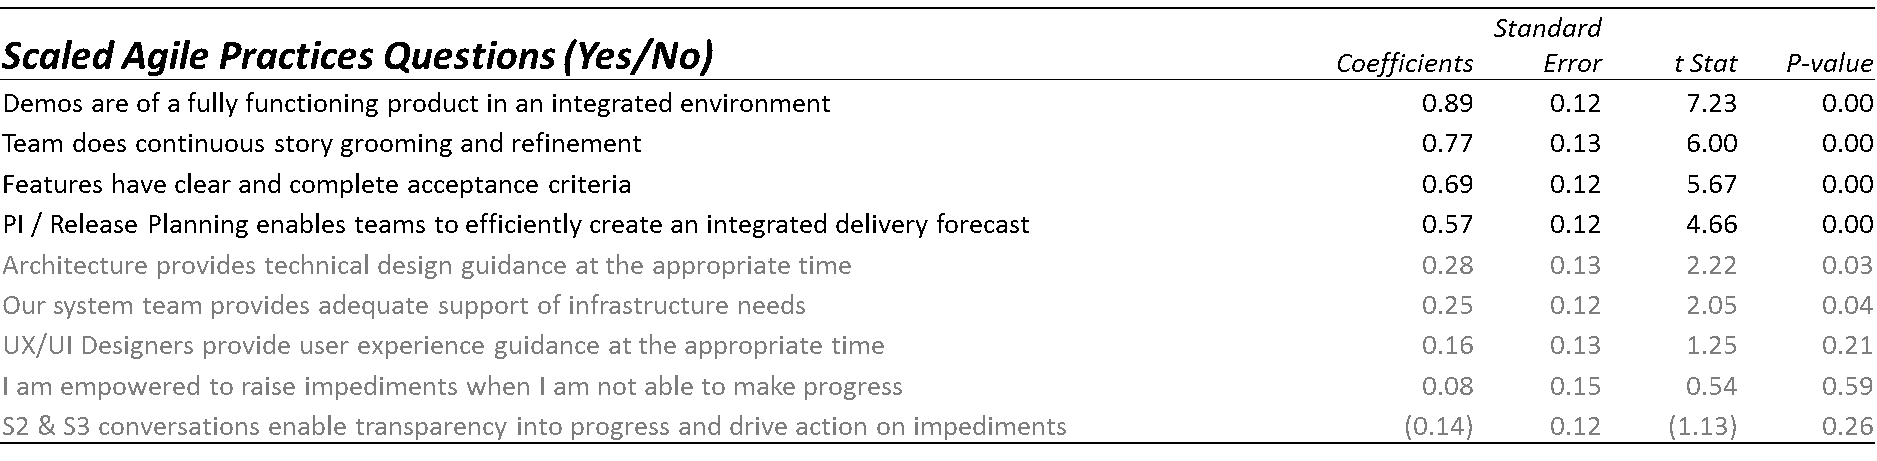 Figure 2. Magnitude of factors on Frequent Delivery of Value
With this analysis, we could reasonably suggest to Agile Champions that they not only focus on the lowest scoring topics but also focus on practices with the largest statistically significant coefficients. We were aware of the limitations of this approach. When we measured the significance of our estimates, we were only explaining about 35-40% of the variance in the differences in outcomes across teams. Our regression analysis showed which of the factors we captured were significant (not zero) and which of those were relatively larger, but plenty of unexplained variance from other causes could be at play. Stated differently, since we don’t see data for questions we didn’t ask – there could be important unmeasured behaviors and practices contributing to higher scores, perhaps factors even more important than the ones we did ask about.
Here is a specific example of how the lens of “high Agile ROI” impacted the way people interpreted and used the survey results. When we looked at the impact of various team health measures on the team NPS score outcome, we found that one popular improvement area – work / life balance – had much less impact on team NPS than team psychological safety. The answer to the question “has trust within the team, enabling open and honest communications” had a 2x greater impact on team NPS than the answer to the question “works at a sustainable pace, enabling adequate work / life balance.” With these findings, we guided Agile Champions to only focus on work / life balance for that small minority of teams for whom it was an issue while focusing on psychological safety generally for all teams. We influenced the focus of individual team Scrum Masters as well as the learning and teaching agendas in our communities of practice.
5. Communication of Results and Addressing Opportunities
The dissemination of the Tech Agility Survey results and formulation of corresponding improvement plans occurred in two distinct contexts: the Tech-wide Organization (CIO) level and the Technology Division (Divisional CIO) level.
5.1 Tech-Wide “CIO” Organization Level
While we iterated with the CIO level executive community on their questions (discussed above under Analysis of Results), we also reviewed the “High Agile ROI” findings derived from our statistical modeling with Tech-wide working groups to influence their roadmaps and priorities for 2018. We presented to our Lean Agile Delivery Excellence (LeADE) council of Agile Champions across Tech, our Agile Learning group responsible for training and our Lean-Agile Community of Practice serving Scrum Masters and other Agile practitioners. We also published an internal blog post in a Tech-wide newsletter that highlighted the “Agile ROI” key themes with links to learning resources that may help the community.
While we were very excited about presenting our tech-wide findings to our leadership and to our Agile Champions communities, we received mixed reactions to the survey methodology and the resulting data. The groups debated whether the survey data could be used reliably: Do the survey recipients know some of the vernacular? Are there assumptions that don’t apply to certain organizations? We found that presenting a combination of the data results with real verbatim comments collected from our teams in the survey helped support the legitimacy of the results. After initial skepticism and learning more about how the survey and analysis were conducted, the new approach to identifying our organization’s “Agile ROI” was well-received.
5.2 “Divisional CIO” Level
As we were communicating aggregate results for Tech-wide distribution, Agile Coaches and Agile Delivery Leads at the Divisional Level were diving into the data, reviewing findings with their leadership and teams. They utilized a combination of the lowest scored questions, open comment themes, and their own observations to identify opportunity areas. Using the lens of the “Agile ROI” findings, they prioritized their improvement plans on the items that we found to lead to higher scores in Frequent Delivery of Value and Team Health. For example, Simon Noone, the Agile Coaching lead for one of the divisions used the Tech Agility Survey results for his specific division to surface these key themes and gain executive buy-in for the accompanying actions:
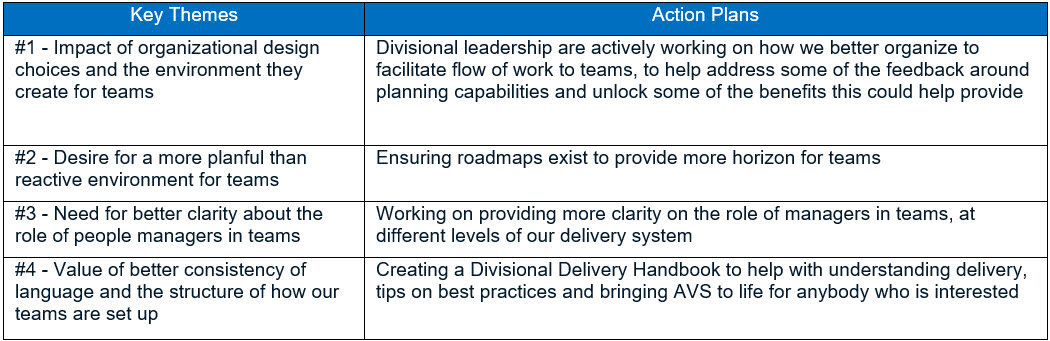
This divisional Agile Coach built out an action plan that addressed a combination of “low-scoring,” “high-ROI,” and local needs gleaned from the survey comments. They addressed a “high-ROI” theme of planning by emphasizing the need for a “more planful than reactive environment” and the commitment to produce longer horizon roadmaps for teams (#2). Specific local needs for better clarity for the role of people managers in teams (#3) and consistency in delivery were identified and addressed by creating a Divisional Delivery Handbook specific to those several dozen teams (#4).
By expanding the analysis of the Tech Agility Survey to include the “High Agile ROI” results we found with statistical modeling techniques, we gave Agile Coaches and Agile Delivery leads a broader set of inputs that they could then use to formulate their local plans. We found that the “High Agile ROI” analysis was best received and best used as a prompt and a justification for including opportunities to strengthen adequate areas alongside addressing more immediate or pressing concerns about delivery. The “High Agile ROI” agenda did not become a one-size-fits all agenda for the enterprise, but rather an additional guide post that our Agile Champions could use at multiple levels: divisional, team-of-teams and intra-team.
6. What comes next
After we conducted the Tech Agility Survey in the fall of 2017, we recognized the need to do a significant redesign of the survey to make it shorter and truly applicable to measuring “agility” for all our teams, not just capital-A Agile teams. We shortened the survey from 100 questions to 50 questions and rewrote the remaining questions to eliminate Agile jargon. We also decided that as an enterprise several years into its Agile Transformation, the topics related to product management (Intent) and Inner-sourcing warranted more depth than the topics after planning which are more typically the focus of traditional Agile coaching efforts. So while the total survey is about 50% shorter, we actually made the sections for Intent and Innersourcing about 20% longer. We’re also working with our enterprise head of people analytics to do a better job of joining this survey with other internal data to make it more useful for our stakeholders.
7. What We Learned
When presenting information to senior executives, it’s useful to do the legwork ahead of time to understand what metrics and data sources they are already using so that you can get a jump on the logistical efforts it will take to get access and collaboration with the owners of those datasets. Our most useful analyses required us to enrich the survey data with job titles, roles, level, type of team, location, etc. We needed to use other internal organizational datasets to analyze results using categories that mattered to our executives’ questions.
We had to become adept at telling the story from both “left brain to right brain” and “right brain to left brain,” depending on our audience. For audiences with more statistical sophistication and experience with modeling, it was important to start with the statistics and demonstrate to them that our methodology was sound before sharing with them the results. For audiences with a practical interest in the survey results, we found that it was more effective to start with the results and then explain the statistical methodology we had used. Audiences like our Lean Agile CoP and Lean Agile Delivery Excellence group needed to be grounded in the specifics of our recommendations. Often getting to the “Aha!” for these audiences required helping them understand how regression analysis works and why it’s different from the more common descriptive summaries (look at high/low by dimension) after sharing the results.
We also learned that while the initial innovation of using an implicit Agile maturity causal model to identify high-ROI Agile coaching opportunities was grounded in good analytic reasoning and techniques, it was equally -if not more – important to invest time and effort into the packaging and communication of the results – graphics, simplicity of language, and motivation for change. The results weren’t self-evident to all of our stakeholders – they had to be communicated and sold to our different constituencies.
8. Acknowledgements
Thank you to Christine Hales, VP of Delivery Transformation and to Chris Barker, Senior Director of Agile Enablement for giving us a great balance of freedom, trust, and guidance as we learn how to coach and influence people to greater delivery excellence at Capital One.
Thank you to Christina Murto, our colleague and partner in crime for this adventure – as well as others! – in Agile coaching. Thank you to Simon Noone for allowing us to reference the action plan for the division he supports as an Agile Coach.
Thank you to our colleagues on the Lean Agile Delivery Excellence (LeADE) Council and the Tech Agility Survey Council at Capital One who give us permission to convene and at times lead our community of Agile Champions at Capital One to greater discovery, maturity and success in our work.
Thank you to Rebecca Wirfs-Brock, our Sherpa, for patiently guiding us through the writing process and helping us tell our story in a way that’s accessible to people who aren’t in large companies operating Agile at scale.