
I like the customer pyramid that David Bland proposed. Whenever I’m discussing an idea for a product with our potential clients, I tend to think in such terms. More often than not people jump into building a thing/part without really validating that the problem even exists.
In our domain there is one problem, though, that is almost universally a pain in the neck. Not only does it exist but people would love to see a reasonable solution. The problem is estimation.
There’s an ongoing, heated discussion under the label of #NoEstimates. The label is misleading though as people tend to pack a lot of different, sometimes incoherent, ideas into that box. At the same time, awareness of available approaches is very limited.
Expert Guess
An option that everyone chooses given no other ideas is to ask someone knowledgeable for an informed guess. We assume that somebody with subject matter expertise would provide a quality estimate.
The planning fallacy described by Roger Buehler shows that we fail at estimating tasks we have expertise. Not only that — more experience in doing similar tasks doesn’t help to improve the estimates.
It doesn’t mean that we can’t change the quality of estimates provided by experts. Douglas Hubbard argues that the calibration process can significantly improve the quality of such estimates. This technique doesn’t seem to be even remotely close to known, let alone popular, in the software industry.
Story Points and Velocity
Agile teams almost universally would know about Story Point estimation combined with tracking Velocity. Using an abstract measure of Story Points, in theory, makes us focus on the relative sizes of tasks. We avoid thinking how much real-time would be needed to build each of the tasks. Dan Kahneman in his profound book Thinking Fast and Slow lists a number of biases that make it hard for our brains to come up with reasonable time-based estimates.
We use Velocity, which is a number of Story Points completed in a time box, to figure out progress and plan further work.
The biggest value that we got from this technique was introducing us to the use of historical data to project future work. Ultimately we use historical Velocity to come up with an idea about how much a team can chew through in the next time box.
At the same time, there are many dysfunctions typically seen with this approach. What’s more, after studying data from ten thousand Agile teams, Larry Maccherone reported that Velocity isn’t any better at figuring out the pace of progress than simply counting completed features. Only recently Steve Rogalsky reported the same after tracking Velocity and throughput for more than a year.
Sizing
A slightly more abstract idea is to use other means of sizing than Story Points. The most popular one is T-shirt sizing: S, M, L, etc. Typically the sizes aren’t numbers that we can simply compare one with another.
This creates a challenge that, in turn, gives us more insight into the work items we already built. We need to figure out how much bigger an L-sided item is than an M-sized one. This means further analysis of historical data to figure out the differences.
We know more, yet Larry Maccherone’s argument is still valid. Sizing doesn’t seem to be better in assessing pace of work than a simpler measurement of throughput.
Throughput
Throughput (the number of items completed in a given time) is probably the most lightweight measurement we can use to estimate the work. In this case, we don’t estimate individual items at all. We just base it on a sheer number of features and some insights we get after analyzing past data.
There’s one improvement to this approach that I find valuable. During discussions about sizing or Story Point values sometimes there is an argument that a work item is too big and an item should be split into smaller ones. Another similar argument is when a team really has no idea about a feature. That makes such a feature more risky.
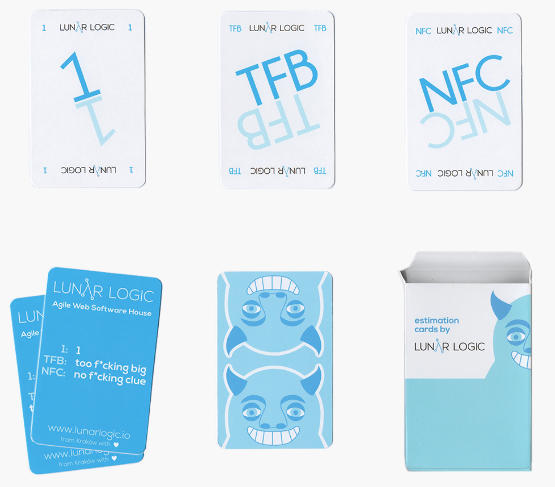
That’s why my favorite feature or story estimation scale is: 1, too big, no clue. You can actually get a deck of such cards if you want one.
This approach limits the discussion about estimation to the minimum yet still provides valuable information about work items.
Simulation
Step by step we evolved from using guesses or assessments of individuals to basing more on historical data. We can do even better though. One approach would be to measure throughput week by week. That would equip us with a range of possible values of throughput and based on that we can come up with the worst and the best possible scenario.
This way we’d get a range estimate. It is always better than a point estimate. However, we can do better than that.
We can use statistical simulation, known as the Monte Carlo method, to simulate a lot of possible results. Given that we’d have thousands of such data points, they’d form a distribution of possible outcomes. We can use it to provide a probability that we’d be done by a given date for all the available dates, e.g. there is 60% chance that we will be done by the end of March, a 70% chance it will be half of April, etc.
Now, we are already into something. It’s not just a single range. It is a comprehensive list that shows a lot of possible future scenarios.
Cycle Time and Work in Progress
There is more though. In the previous case, we used throughput as the simplest available proxy metric. We have more meaningful historical data that we can use though.
Cycle time is time that elapsed from the start of work on a given feature till it was finished. Work in Progress (WIP) is a number of items that have been started and haven’t been finished at any given moment. A nice thing is that we need only two dates per work item to figure out both cycle time and WIP: start date and finish date.
One big gain from such a strategy is that we can start a simulation even with fairly few data samples. We don’t need to wait long weeks till we have enough data samples for throughput. It also takes the ongoing situation into account. We’d see different dynamics and predictability in a team with lots of Work in Progress and long cycle times than in a team that limits WIP and has short cycle times.
For those willing to dig deeper into the details of how this simulation can be done, I recommend Forecasting and Simulating Software Development Projects authored by Troy Magennis.
Estimation and Forecasting
In the title of the post, I referred to both estimation and forecasting. So far I have referred only to the former. What is the other thing then? The last approach, which employs statistical simulation instead of expert guesses, is typically called forecasting.
Where exactly does the estimation end and forecasting start on the path I’ve just walked you through? Personally, I don’t think the answer to this question is that important. What matters is being aware of available methods and understanding how they work.
That is by the way why I’m not that much into the #NoEstimates discussion even if some things I promote, e.g. 1 / too big / no clue estimation scale or simulations, are frequently labeled that way.
When I talk more about forecasting, and I only scratched the surface here, I frequently hear one comment. People mention that it seems appealing yet rather complex. It would be great if someone could try the results it produces without investing much work into researching all the details.
Well, I have good news. At Lunar Logic we are running some experiments around forecasting and are looking for teams and organizations that want to test some of the early results. It is pretty straightforward – based on some historical data points we’d provide a forecast for a further batch of work and then we’d validate forecast quality together. Drop me an email if you’re interested.